


Data Warehousing Objects
Fact Table:
Requirements of Fact Table:
Dimension Table:
If we are saying in simple word, Conformed
dimension table is a table which is having at least one or multiple primary key
or unique key to join with one or multiple fact table. For example product
table is related with the sales fact table
Dimensions are conformed when they are either exactly the
same (including keys) or one is a perfect subset of the other. Most important,
the row headers produced in the answer sets from two different conformed
dimensions must be able to match perfectly.
Hierarchies
Dimension hierarchies also
group levels from general to granular. Query tools use hierarchies to enable
you to drill down into your data to view different levels of granularity. This
is one of the key benefits of a data warehouse.
Levels
Level Relationships
Typical Dimension Hierarchy

Wherever we go, we have to know this concepts to work on data warehousing technologies.
Cheers!
Bose
Creating Presentation Layer of SH Repository
The main purpose of building the Presentation catalog in Presentation Layer is to provide the useful and necessary data from the end-users perspective i.e. different view of data for business measures are provide for different type of users.
Steps for making Presentation catalog in Presentation Layer are as follows:
1)In case you closed the rpd file, use the following steps to open the repository.
a)Select Start >Programs > Oracle Business Intelligence > BI Administration.
b)Select File > Open > Offline.
c)Double-click SH.rpd to open the repository file.
d)Enter the following parameters:
User: Administrator
Password: Administrator
e)Click OK.
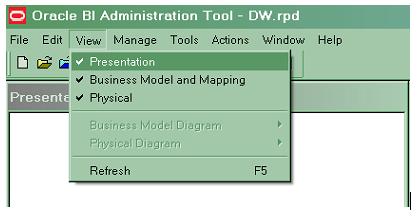
2)Verify that the Presentation layer is visible. If it is not visible, select View > Presentation from the menu bar.
3)Make the DW Business model available for Queries. To do so, double click on the DW business model in the BMM layer > select the Checkbox for

4)Drag the DW Business Model folder from the Business Model and Mapping Layer to the Presentation Layer. Thus the DW presentation catalog is created in Presentation Layer.
5)Reordering the columns of DW presentation catalog.
a) Expand the DW presentation catalog.

b) Double click the Customers table and select the column tab.
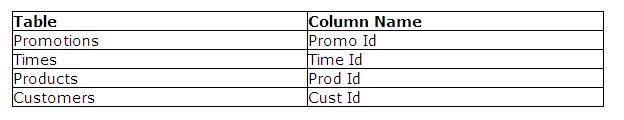
c) Change the order of columns using Up and Down buttons. Select the column and then click on Up or Down button. After rearranging it should appear as :

d) Click OK to close the window.
6)Similarly reorder the other columns by following the method described in step 4 in following order.

7)Rename the columns of DW presentation catalog.
a) Expand the Products presentation table.
b) Double-click the Prod Name column, select the General tab in the Presentation Column dialog box and uncheck the Use Logical Column Name.
c) Change the column name by typing Product Name in the name field.
d) Click OK.
8) Repeat the process till all the column of Products presentation table get name as:

Note: Alternatively you could rename these columns in the Business Model & Mapping layer (manually or using Rename wizard shown previously)
9)In order to meet end user’s requirement we have to hide/delete some columns from presentation Layer which are not used by users or are required in Business Model & Mapping layer. For this purpose you have to perform deletion of unnecessary columns:
a)In the Channels presentation column, select the Channel Id and press
Delete key from keyboard.
b) Click Yes to delete the object.
c) Similarly delete the following columns from the presentation tables.
10)Verify the presentation tables for the changes you made.
11)Save the repository. Do not check global consistency.
Tip:
Drag and drop the business model from the business model and mapping layer onto the presentation layer, this ensures faster creation of the presentation model.
Testing and Validating Repository Consistency Check
Before testing the repository by running queries using Oracle BI Answers, you have to check the consistencies of repository and its business model.
Steps of checking repository are as follows:
1)If you haven’t open the Oracle BI Administration tool just open it by following steps.
a)Select Start > Programs > Oracle Business Intelligence > BI
Administration.
b)Select File > Open > Offline.
c)Double-click SH.rpd to open the repository file.
d)Enter the following parameters:
User: Administrator
Password: Administrator
e)Click OK.
2)Select File > Check Global Consistency (Shortcut – You can select the presentation catalog and press CTRL + K)
3)If any error appears in Consistency Check Manager, then edit the repository to correct the inconsistencies and rerun Check Global Consistency as in step 1.

4)Consistency Check Manager can show three type of messages:
Error:
These messages indicate that there has been some inconsistency in the model and need to be fixed before querieng. If you get these errors then go through the error description and fix it before proceeding.
Warning:
These messages show some warning messages which may or may not cause any errors.
Best Practices:
These messages are displays information about the best practices, which can be followed.
5)On successfully and errorless appearance of Consistency Check Manager, click on Close.
So, Finally we have built the RPD for SH schema and will learn how to create our first report using this presentation catalog and How to add that report into the Dashboard.
Keep Rocking!!!
Building the Business Model & Mapping Layer
The main purpose of the business model is to capture how users think about their business using their own business terms. The business model simplifies the physical schema and maps the users’ business terms to physical sources.
There are two main categories of logical tables: Fact and Dimension. Logical fact tables contain the measures of organization’s business operations and performance. Logical dimension tables contain the data used to qualify the facts.
A. Follow the instructions in case you closed the admin tool or else go to point
1) In order to define logical table structure in DW Business Model, you will
use Oracle BI Administration tool.
a) Select Start > Programs > Oracle Business Intelligence > BI
Administration.
b) Select File > Open > Offline.
c) Double-click SH.rpd to open the repository file.
d) Enter the following parameters:
User: Administrator
Password: Administrator
e) Click OK.
2) Create a Business Model by right clicking in the white space in the Business Model and Mapping layer and select New Business Model. In the name field, name the business model as DW and click OK. Alternatively, you could drag and drop the Physical schema to create the initial Business Model.

3) Create logical tables by right-clicking on DW business model and select New Object > Logical Table and name it Sales Fact in the Logical Table dialog box and click OK.

4) Create Logical column of Sales Fact table
a) In The Physical Layer expand SALES table.
b) Select and drag AMOUNT_SOLD column from the Physical layer to the Sales Fact logical table in the Business Model and Mapping layer. A new AMOUNT_SOLD logical column is added to the Sales Fact logical table.
In the Business Model and Mapping layer, double-click AMOUNT_SOLD logical column to open the Logical Column dialog box.
c) Go to the General tab and in the Name field, rename the column to “Amount
Sold”
d) Click the Aggregation tab.
e) In the Default aggregation rule drop down list, select SUM.
Aggregation rule determines the aggregation type to be used in the SQL
query generated by OBI. For example, sum, avg, count etc.
f) Click OK to close the Logical Column dialog box. Notice that the logical column icon is changed to indicate an aggregation rule is applied.
g) Pull the QUANTITY_SOLD column from the SALES table to the Sales Fact
h) Add the aggregation rule as SUM for Quantity Sold logical column.
It should appear as like below

5) Create Dimensions in Business Model and Mapping Layer as follows :
a) Select the following tables in the Physical layer.
CHANNELS, TIMES, PRODUCTS, CUSTOMERS and PROMOTIONS
b) Drag the selected tables from the Physical layer onto the DW
business model folder in the Business Model and Mapping layer. This
automatically creates logical tables in the Business Model and
Mapping layer.

c) Right-click the DW business model and select Business Model
Diagram > Whole Diagram.
d) Place the Sales Fact table in the middle. To adjust the zoom
factor, right click on the empty space of diagram window and select
the zoom.

e) Click the New Join button in the toolbar.

f) Click on the PRODUCTS table icon first and then click on Sales Fact
table icon in the Logical Table Diagram. The Logical Join dialog box
opens. Leave the defaults as they are and click OK.

g) The join is creating a one-to-many (1:N) relationship that joins the
key column in the first table to a column that is a foreign key in the
second table. Create the joins and repeat the steps for the remaining
tables. You don’t have to specify any join conditions in Business
Model; BI server will pick the joins defined in the Physical Layer.
CHANNELS join with Sales Fact
CUSTOMERS join with Sales Fact
TIMES join with Sales Fact
PROMOTIONS join with Sales Fact
Observe and close Logical Table Diagram window.

6) Select File > Save to save the DW repository
7) Click NO to check global consistency.
8) Remain logged in to the Oracle BI Administration Tool for the next lab.
Rename Business Model
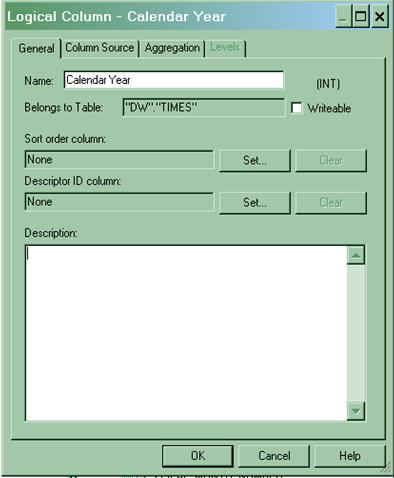
1) To change a column name manually, double click a column and change the name. For example change ‘CALENDAR YEAR’ to ‘Calendar Year’.
2) To automate column name changing, Click Tools > Utilities and from utility dialog box, click Rename Wizard and then Execute.


4) Click the Add Hierarchy button and click Next button.

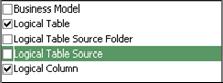
5) First check ONLY Logical Table and Logical Column and click Next.
6) Select All text lowercase and click Add.
7) Click Change each occurrence of ‘_’ into a space and click Add.
8) Click First letter capital and click Add.
Similarly add other rules as per the screenshot. The order of the selected rules is very important, it should appear as shown in next screenshot.

9) Click next and click Finish and verify that logical tables and logical columns in the Business Model and Mapping layer are renamed as per rules.
10) The Logical Table names needs to be renamed further. It can be done manually > right click the logical table > select the Rename option.

11) After renaming, the logical tables it should appear as :

Deleting Unnecessary Business Objects
1) Expand Channels logical table in the Business Model and Mapping layer. Use Ctrl + click to select the ID columns except Channel ID(we have to retain the primary key always).
2) Press Delete key from keyboard or Right-click either of the selected columns and select Delete.
3) Click Yes to confirm delete.
4) Verify that the Channels logical table now has only three logical columns.
5) Repeat the steps to delete the ‘ID’ logical columns from the following tables
a) Customers
b) Products
c) Promotions
d) Times
Note: If you choose ‘ctrl’ button to select multiple object make sure the Logical Table is not highlighted.
6) Save the repository. Do not check global consistency.
In this post, we will learn How to create the relation between the
tables using Physical Layer Diagram.


3.
You
can now drag the tables to move around and rearrange them.


Using the Physical
Diagram approach you can define both Primary and Foreign keys in one step.
In SH Schema, the following is the key that you are going to join
between the table.
PROMOTIONS. PROMO_ID = SALES. PROMO_ID
TIMES. TIME_ID = SALES.
TIME_ID
CUSTOMERS. CUST_ID = SALES. CUST_ID
CHANNELS. CHANNEL_ID = SALES. CHANNEL_ID
Follow the steps to
create physical layer Diagram:
1. In the Physical layer, right-click
the DW data source > select Physical Diagram > Object (s) and All
Joins. The option will be the screen below,

The physical diagram may appear as in screenshot below:

2. Objects will appear very big, but
the zoom can be adjusted. To adjust the zoom level, right click on the white
space and set the zoom level to 100%, as
shown in screenshot below :

Click the Create New
Join button on the toolbar. Using the Foreign Key,
make a join between the tables in the physical Layer.
make a join between the tables in the physical Layer.

4. Click the PRODUCTS table first and then on the SALES table. The Physical Foreign Key
dialog box will open up.
Select
PROD_ID from PRODUCTS and PROD_ID from SALES.

5. Click Ok. If prompted for any question, please select Yes.

6. Repeat the above steps to define
join between all the tables. The join conditions are as follows:

7. When you are finished, click the X
in the upper right corner to close the Physical Diagram.
8. Select File > Save or
click the Save button on the toolbar to save the repository.
9. Click No when prompted to
check global consistency.
10. Leave
the Administration Tool and the DW repository open for the next topic.
Keep saving the repository at regular intervals.
Note:
The order of selecting the tables matters while
defining the joins. The join has one to many relationships. The first table and
the second table have one to many relationships. Generally, there is one to
many relationships between Dimensions and Facts. So, we click on dimension
first and then on Fact.
Congratulations! You have successfully created a new
repository, set up an ODBC data source and imported a table schema from an
external data source into the Physical layer, and defined keys and joins.
Importing Data source from SH Database:
Open the Administration Tool and create New Repository by following the below steps:
1. Select Start > Programs > Oracle Business Intelligence > BI Administration
2. Click File -> New Repository -> Click Ok
3. In the window, give RPD Name "SH", give Username "Administrator" and Password "Administrator"
after that you will get the following blank RPD and it will be saved in the following path
C:\Oracle BI\Server\Repository\SH.rpd
Before going to import the data source from SH schema, we have to create the DSN for SH Schema.
Next click on the file -> import -> from database, then will get the following screen.

Select SH DSN and enter the password of SH schema and click Ok. It will look like the screen by below:

By clicking the "OK" button from the above screen, you will get the following import popup window. so, select SH schema from that window and click import.

Once the tables are imported, we will get all the tables in the physical layer of the RPD. The screen is looking like following:

In the Next Post, we will learn how to create relation between the table by making join between the table using physical layer diagram.
Keep Rocking!!!